1.2 KiB
-
Go to Dashboard / Configuration / SQL Views
-
tip your SQL request

-
Select the group(s) that could have access to the view


Optionnaly, you can add a domain.
A tipical domain in a multi company context is to write
['|', ('company_id', '=', False), ('company_id', 'in', company_ids)]
to make reporting depending on the current companies of the user.
-
Click on the button 'Validate SQL Expression'
-
Once the sql request checked, the module analyses the column of the view, and propose field mapping. For each field, you can decide to create an index and set if it will be displayed on the pivot graph as a column, a row or a measure.

-
Click on the button 'Create SQL elements'. (this step could take a while, if view is materialized)
-
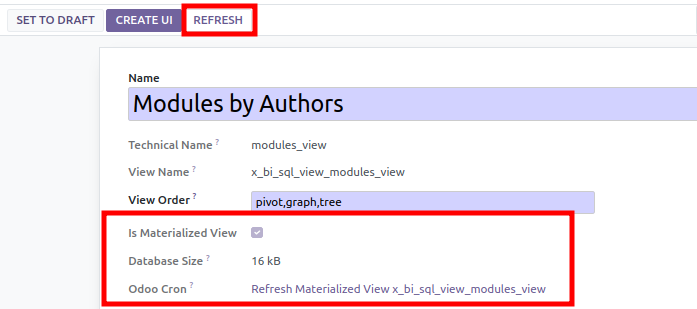
If it's a MATERIALIZED view:
- a cron task is created to refresh the view. You can so define the frequency of the refresh.
- the size of view (and the indexes is displayed)
-
Finally, click on 'Create UI', to create new menu, action, graph view and search view.

